Macy’s, Inc. director Richard L. Markee reported a change in beneficial ownership on a Form 4 filed July 1, 2026, covering a transaction dated June 30, 2026. The filing reports an award or acquisition of Macy’s stock units tied to the company’s common stock. The reported derivative security consisted of **1,322 stock units** valued at an average price of **$20.8064 per share/unit**. The filing notes that the price represents the **average value of the stock units granted each month during the quarter** covered by the report. The transaction appears to relate to director compensation rather than an open-market purchase or sale. The stock units are described as convertible on a **1-for-1 basis** into Macy’s common stock. However, they are not immediately settled; the filing states that the units will be settled in common stock **upon Markee’s termination from Macy’s Board of Directors**. Following the reported transaction, the filing indicates beneficial ownership of **1,322 derivative securities** in the form of these stock units. No cash sale of Macy’s shares was reported, and the filing does not indicate a disposition of common stock. The report was signed on Markee’s behalf by **Wendy A. Beadles**, acting as attorney-in-fact under a power of attorney, on July 1, 2026.
Stock detail
Macy's (M) stock price, chart, and key data
View Macy's stock price, chart movement, and headline metrics on Woodstock's stock detail page.
Stock detail
Macy's
M · XNYS
+$1.98 (+8.25%) past day
$25.97
Overnight $25.69 (-1.08%)
Key metrics
Financials
Quarterly revenue, profitability, and balance-sheet snapshot
Dividend
Past Dividend Performance
$0.18
$0.19
$0.19
Annual Dividend Yield
2.95%
Dividend
$0.19 / Stock
Frequency
Quarterly Payment
Day range
$22.90 - $24.45
Close price
$23.33
Market cap
$6.1B
P/E ratio
112.93
About the company
Macy's Inc.
Macy's, Inc. is an American holding company of department stores. Upon its establishment in 1929, Federated held ownership of the regional department store chains Abraham & Straus, Lazarus, Filene's, and Shillito's. Bloomingdale's joined Federated Department Stores the next year. Throughout its early history, frequent acquisitions and divestitures saw the company operate a number of nameplates. In 1994, Federated took over Macy's, the old department store chain originally founded in 1858 by American entrepreneur Rowland Hussey Macy. Despite Federated's long history of preserving regional nameplates, its acquisition of the May Department Stores Company in 2005 marked the end of those nameplates. By the following year, both the Macy's and Bloomingdale's brands had replaced them nationwide. Ultimately, Federated itself was renamed Macy's, Inc. in 2007; the company bought Bluemercury in 2015 from Berry J. Beck and Marla Malcolm Beck, allowing the company to expand into beauty stores. Macy's, Inc. owns the department store chains Bloomingdale's and Macy's, and beauty store chain Bluemercury, all of which operate flagship stores in Manhattan.
Analyst rating summary
A current read on analyst sentiment from the insight feed.
Mean target
$22.33
8
Hold
/ 10
Recent calls
07/07/2026
Morgan Stanley
Alexandra Straton
Buy · Price target $30.00
06/22/2026
TD Cowen
Oliver Chen
Hold · Price target $25.00
06/03/2026
Goldman Sachs
Brooke Roach
Hold · Price target $21.00
Ticker holders
Review politician disclosures and insider transactions in tabs.
Holder directory
Select a heading to reorder by name, activity date, buy/sell, or displayed value.
#1Dean Phillips
democrat · House · MN-3
- Buy$1,001 / $8,001 / $15,000
- Sell$1,001 / $8,001 / $15,000
- Buy$1,001 / $8,001 / $15,000
- Sell$1,001 / $8,001 / $15,000
- Buy$1,001 / $8,001 / $15,000
- Sell$1,001 / $8,001 / $15,000
#2Debbie Dingell
democrat · House · MI-6
- Sell$15,001 / $32,501 / $50,000
#3Gilbert Cisneros
democrat · House · CA-31
- Buy$1,001 / $8,001 / $15,000
- Sell$1,001 / $8,001 / $15,000
#4Ro Khanna
democrat · House · CA-17
- Sell$1,000 / $8,000 / $15,000
Market action
A concise summary of the latest filing, transaction, or market-moving item.
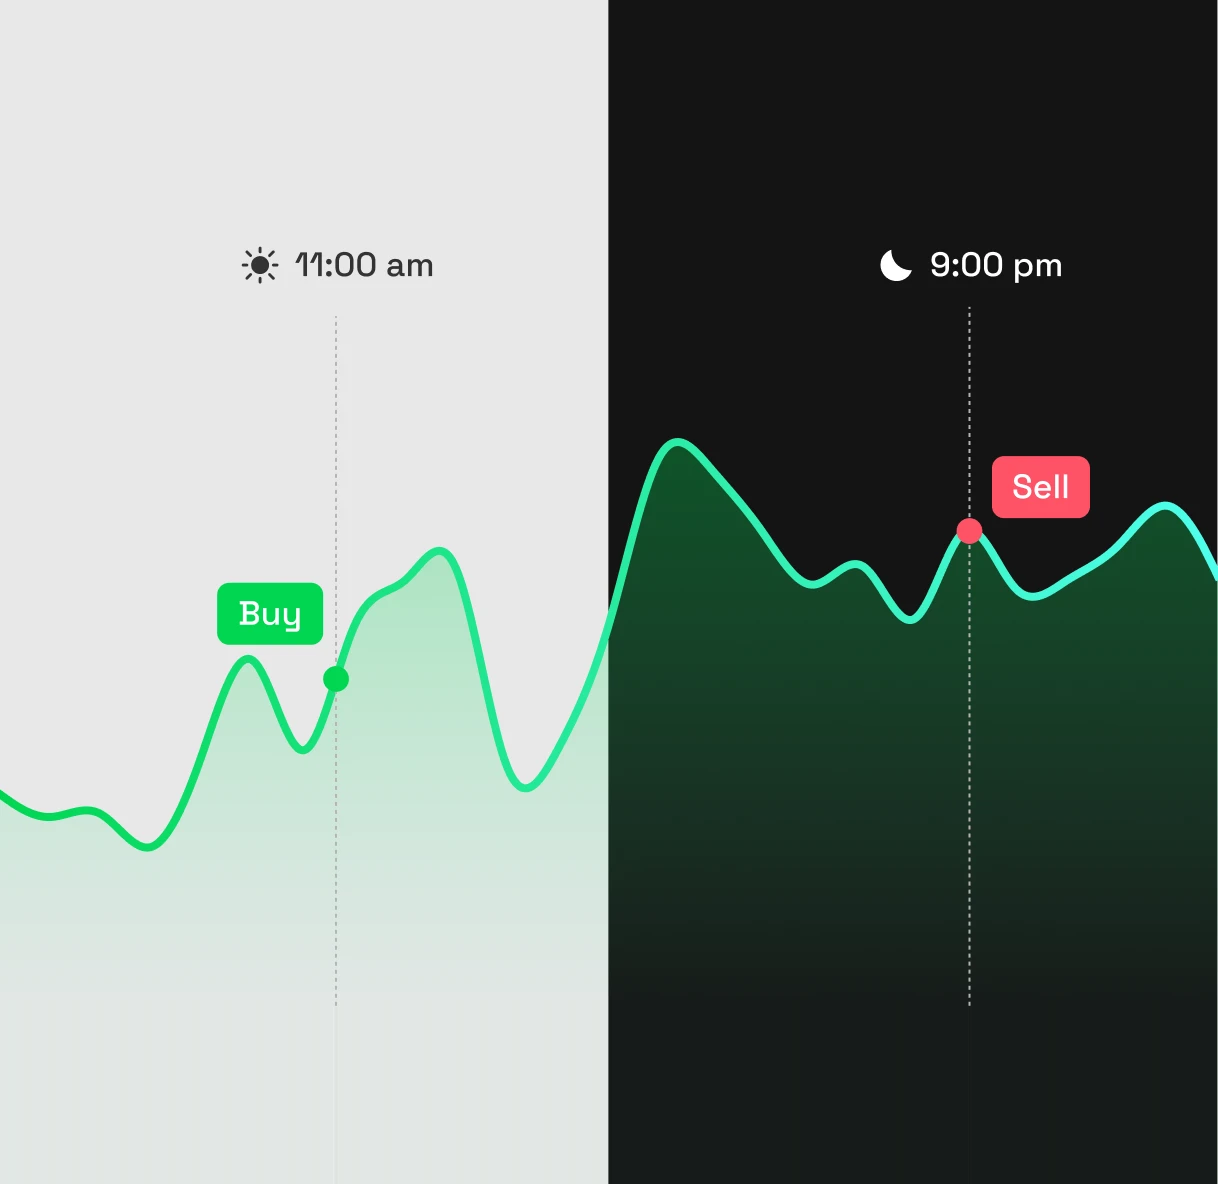
24/5 Trading
Act on the stock when the timing works for you.
With Woodstock, you can move from chart review to order placement in one flow. Trade eligible US stocks 24/5, even outside regular market hours.
*24-hour trading is available except during system maintenance. Some stocks are not eligible for extended-hours trading.
Download the app