Stock detail
Exxon Mobil (XOM) stock price, chart, and key data
View Exxon Mobil stock price, chart movement, and headline metrics on Woodstock's stock detail page.
Stock detail
Exxon Mobil
XOM · XNYS
-$12.34 (-8.29%) past day
$136.43
Pre-market $147.78 (+8.32%)
Key metrics
Earnings
Past Income Statement
Dividend
Past Dividend Performance
$1.03
$1.03
$1.03
Annual Dividend Yield
3.02%
Dividend
$1.03 / Stock
Frequency
Quarterly Payment
Day range
$110.96 - $114.17
Close price
$147.36
Market cap
$610.8B
P/E ratio
136.43
About the company
ExxonMobil Holdings
ExxonMobil is an integrated oil and gas company that explores for, produces, and refines oil worldwide. In 2025, it produced 3.3 million barrels of liquids and 8.4 billion cubic feet of natural gas per day. At the end of 2025, reserves were 19.3 billion barrels of oil equivalent, 69% of which were liquids. The company is one of the world's largest refiners, with a total global refining capacity of 4.1 million barrels of oil per day, and is one of the world's largest manufacturers of commodity and specialty chemicals.
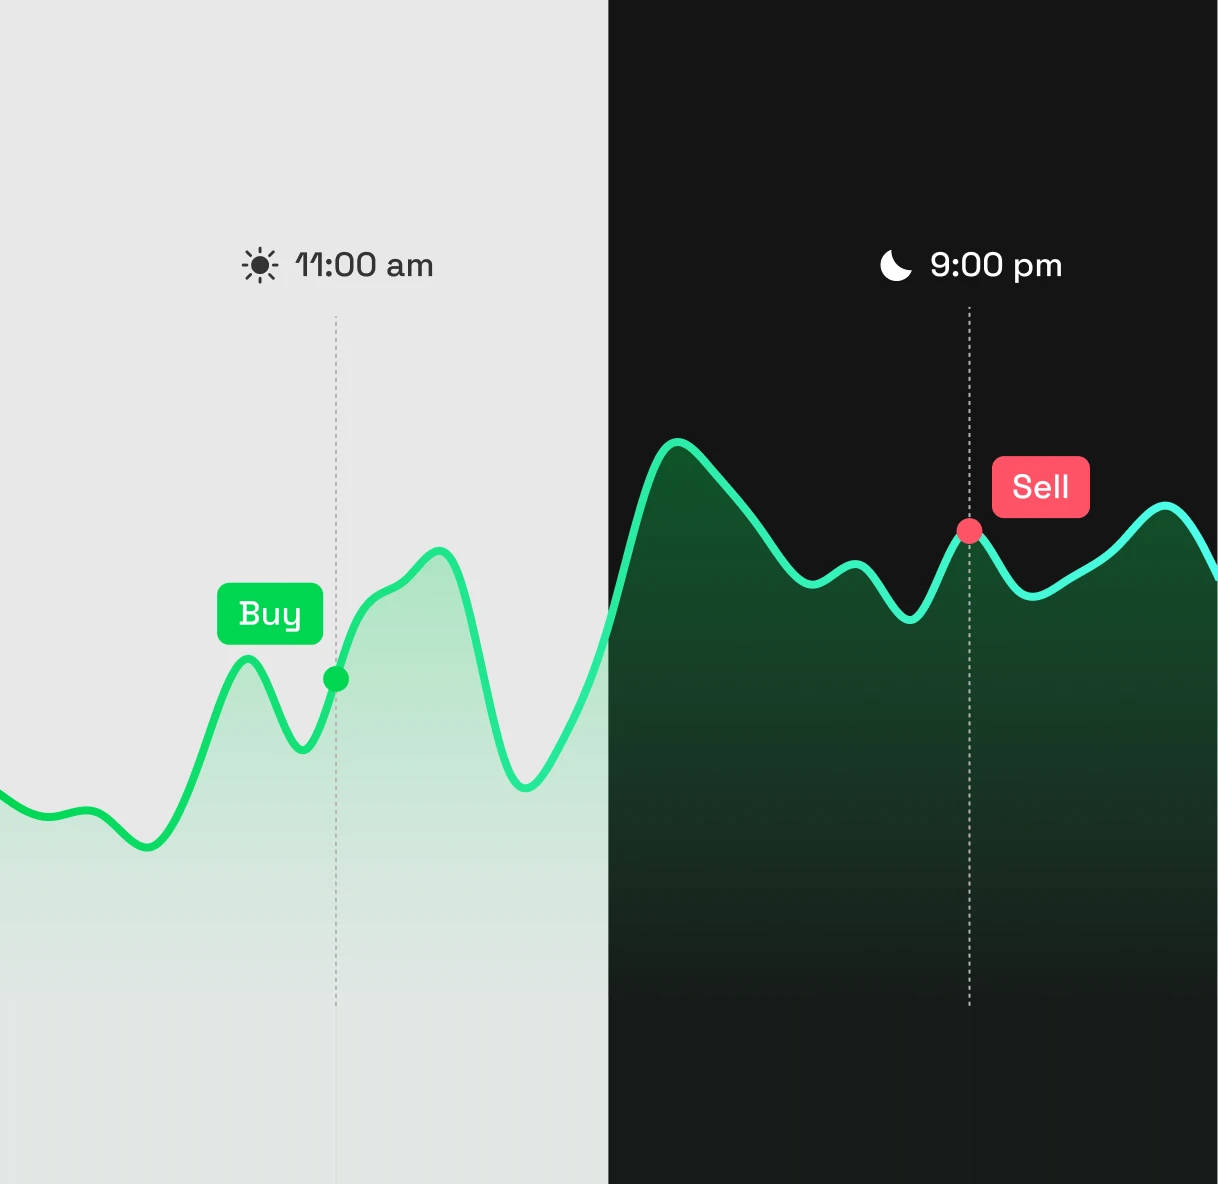
24/5 Trading
Act on the stock when the timing works for you.
With Woodstock, you can move from chart review to order placement in one flow. Trade eligible US stocks 24/5, even outside regular market hours.
*24-hour trading is available except during system maintenance. Some stocks are not eligible for extended-hours trading.
Download the app