Stock detail
Citigroup (C) stock price, chart, and key data
View Citigroup stock price, chart movement, and headline metrics on Woodstock's stock detail page.
Stock detail
Citigroup
C · XNYS
+$3.05 (+2.35%) past day
$132.98
After hours $128.76 (+0.04%)
Key metrics
Earnings
Past Income Statement
Dividend
Past Dividend Performance
$0.60
$0.60
$0.60
Annual Dividend Yield
1.69%
Dividend
$0.60 / Stock
Frequency
Quarterly Payment
Day range
$60.76 - $62.00
Close price
$128.71
Market cap
$217B
P/E ratio
46.32
About the company
Citigroup Inc.
Citigroup is a global financial powerhouse that orchestrates the movement of $5 trillion in daily transaction volume, serving as the essential connective tissue for the world's most complex multinational corporations. The firm remains a leader on the global stage, servicing 90% of the Fortune 500 through a proprietary network that includes direct membership to over 270 cash-clearing centers and a footprint that spans 94 countries. After a checkered history operating as an overly complex, disjointed firm, steps have been taken to streamline operations, resulting in organization across five segments: services, markets, banking, wealth, and US personal banking.
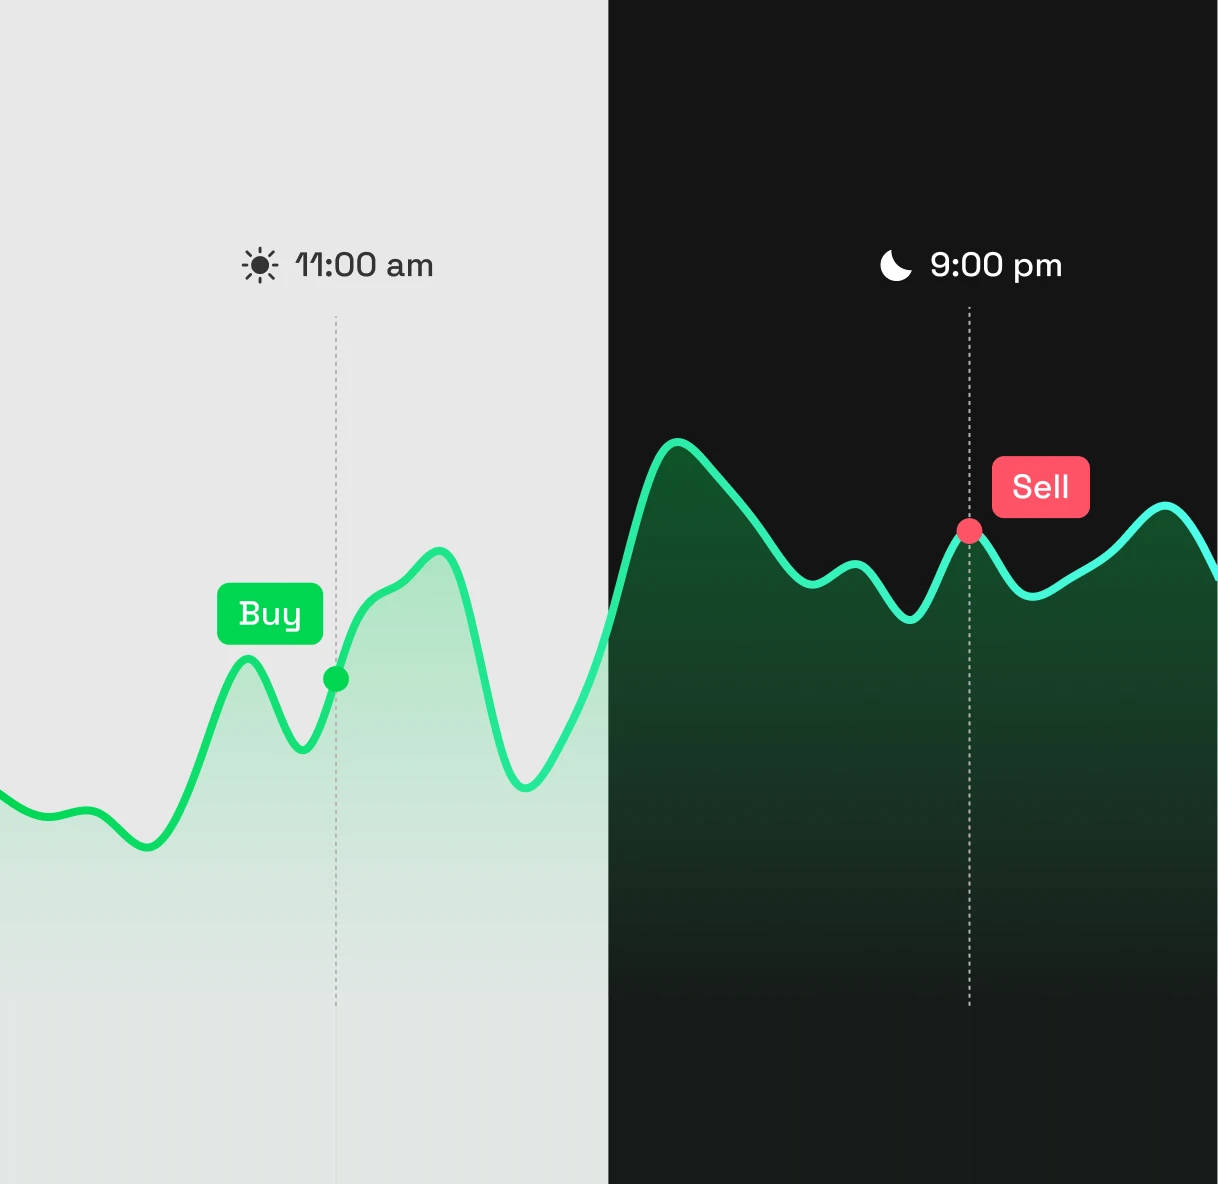
24/5 Trading
Act on the stock when the timing works for you.
With Woodstock, you can move from chart review to order placement in one flow. Trade eligible US stocks 24/5, even outside regular market hours.
*24-hour trading is available except during system maintenance. Some stocks are not eligible for extended-hours trading.
Download the app