Stock detail
Dollar General (DG) stock price, chart, and key data
View Dollar General stock price, chart movement, and headline metrics on Woodstock's stock detail page.
Stock detail
Dollar General
DG · XNYS
-$4.62 (-3.73%) past day
$119.34
Overnight $126.10 (+5.67%)
Key metrics
Earnings
Past Income Statement
Dividend
Past Dividend Performance
$0.59
$0.59
$0.59
Annual Dividend Yield
1.98%
Dividend
$0.59 / Stock
Frequency
Quarterly Payment
Day range
$133.92 - $141.42
Close price
$123.20
Market cap
$27.5B
P/E ratio
59.67
About the company
Dollar General Corp.
Since its beginning in 1939, Dollar General has grown to become the largest dollar store operator in the United States, with more than 20,000 small-box discount stores across 48 states. The firm generated over $42 billion in fiscal 2025 sales. The retailer maintains a heavy concentration of stores in rural and low-income markets underserved by big-box retailers. It's 11,000 stock-keeping units, including 2,000 priced at $1 or less, span consumables (82% of sales), seasonal items (10%), home products (5%), and apparel (3%). More than 20% of sales are derived from private label.
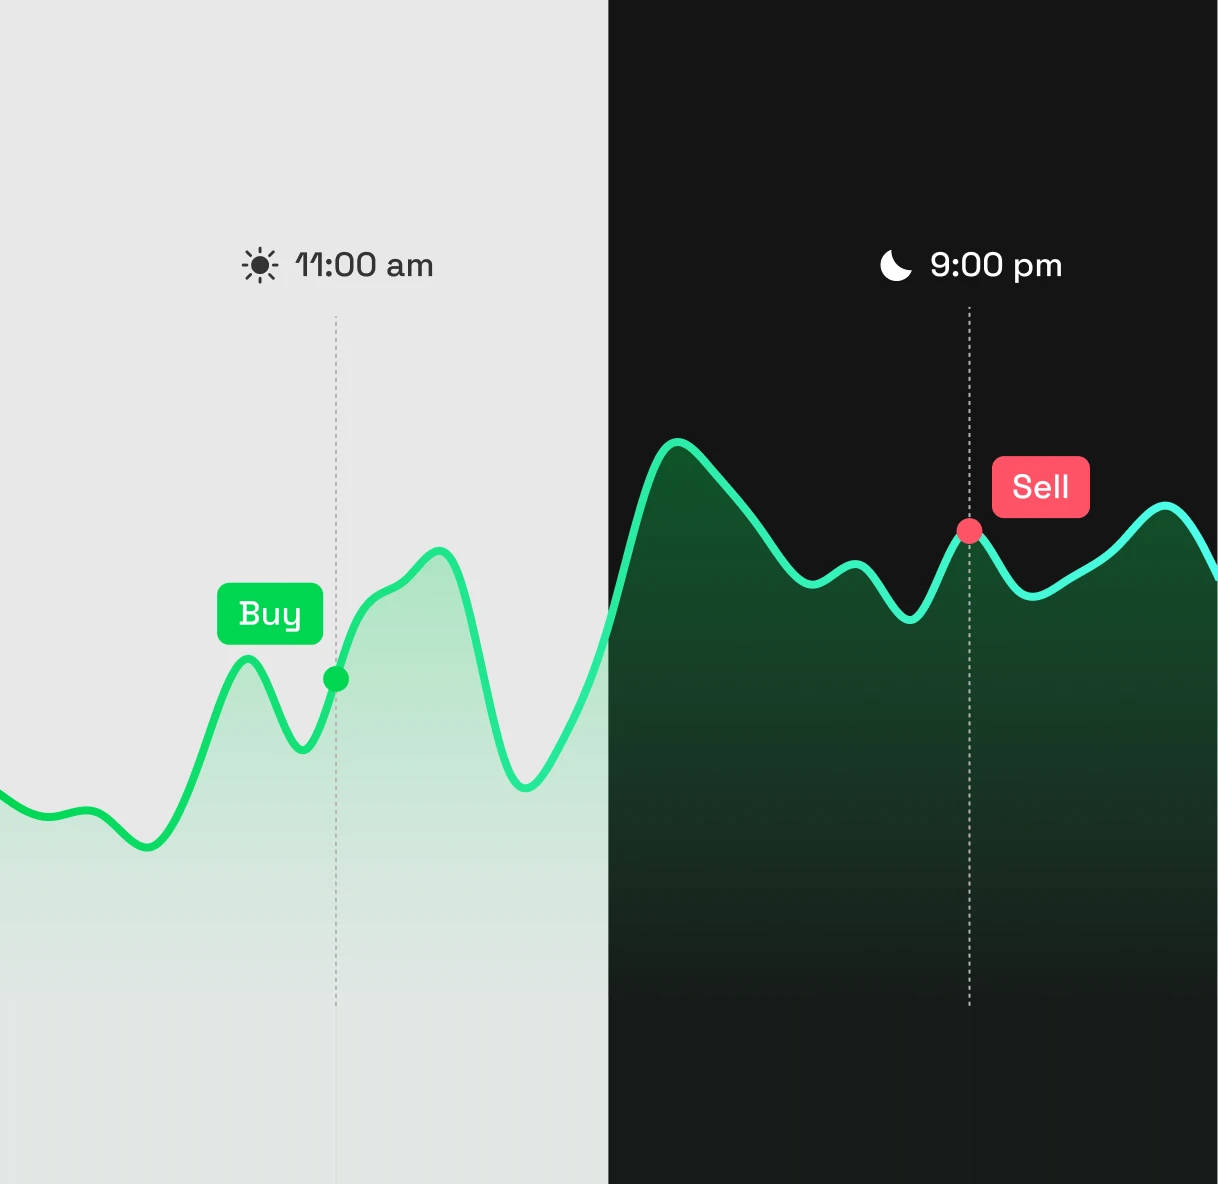
24/5 Trading
Act on the stock when the timing works for you.
With Woodstock, you can move from chart review to order placement in one flow. Trade eligible US stocks 24/5, even outside regular market hours.
*24-hour trading is available except during system maintenance. Some stocks are not eligible for extended-hours trading.
Download the app