Stock detail
S&P Global (SPGI) stock price, chart, and key data
View S&P Global stock price, chart movement, and headline metrics on Woodstock's stock detail page.
Stock detail
S&P Global
SPGI · XNYS
-$17.13 (-3.79%) past day
$435.39
After hours $445.34 (-0.67%)
Key metrics
Earnings
Past Income Statement
Dividend
Past Dividend Performance
$0.97
$0.97
$0.97
Annual Dividend Yield
0.95%
Dividend
$0.97 / Stock
Frequency
Quarterly Payment
Day range
$427.00 - $434.64
Close price
$448.35
Market cap
$133.4B
P/E ratio
87.17
About the company
S&P Global Inc.
S&P Global provides data and benchmarks to capital and commodity market participants. Its ratings business is the largest credit rating agency in the world and S&P's largest segment by profitability. S&P's largest segment by revenue is market intelligence, which provides desktop, data and advisory solutions, enterprise solutions, and credit/risk solutions mostly in the financial-services industry. S&P's other segments include energy (formerly commodity insights, this segment includes Platts and other data), mobility (Carfax), and indexes. S&P plans to spin off mobility in 2026.
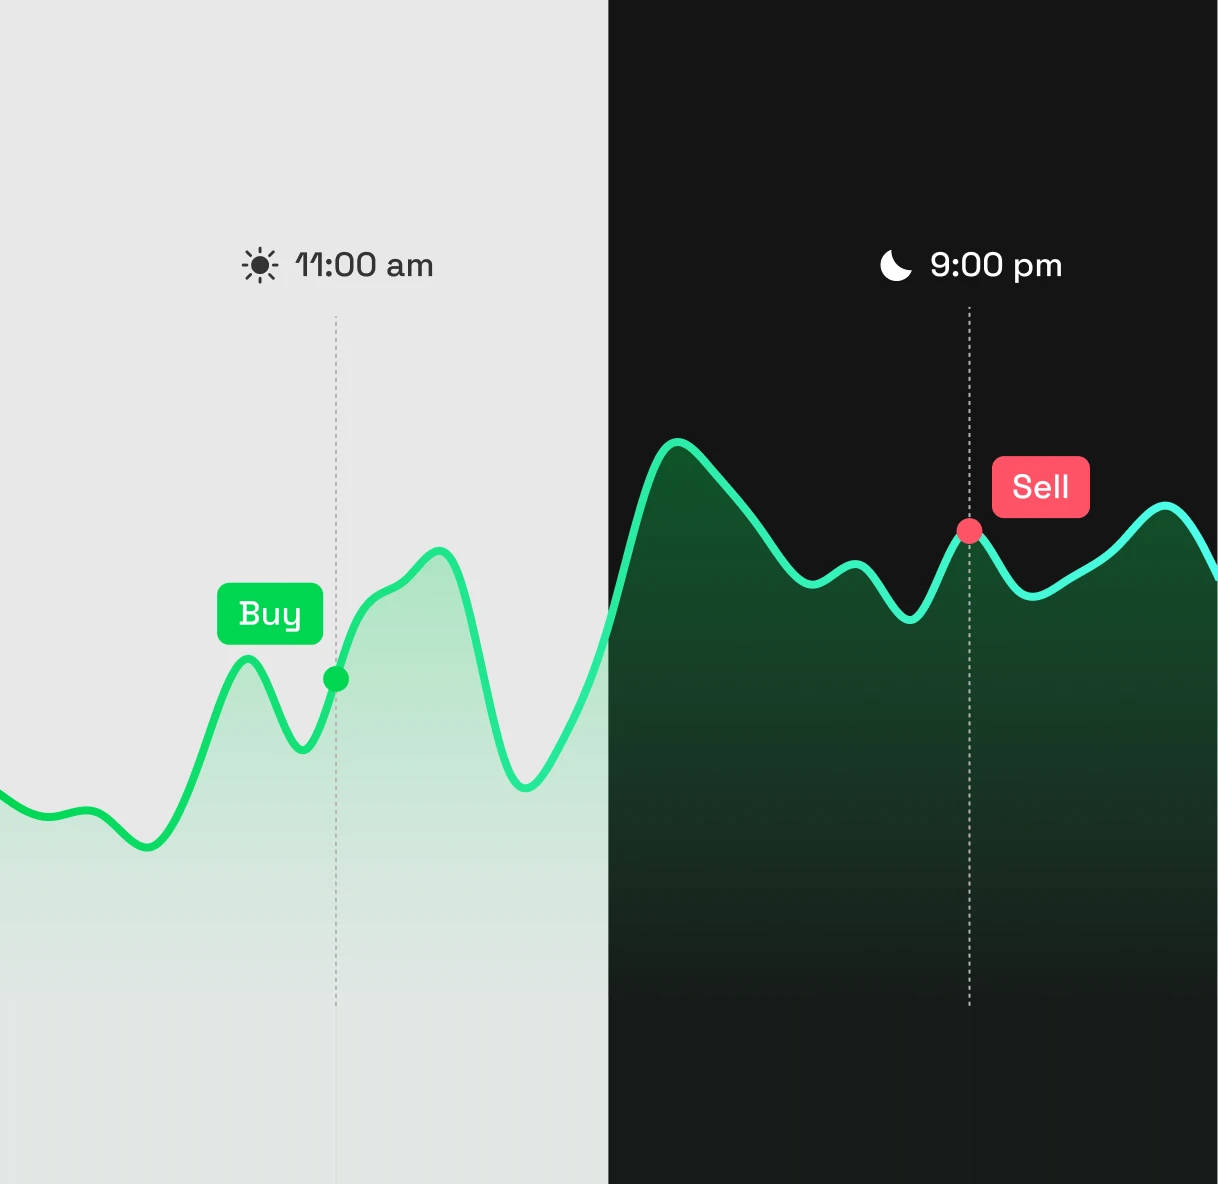
24/5 Trading
Act on the stock when the timing works for you.
With Woodstock, you can move from chart review to order placement in one flow. Trade eligible US stocks 24/5, even outside regular market hours.
*24-hour trading is available except during system maintenance. Some stocks are not eligible for extended-hours trading.
Download the app